Website Speed Optimisation: The Complete Guide for UK Businesses (2026)
Updated April 2026 · By Gareth van Rensburg, Yoho Digital | If your website takes more than three seconds to load, more than half your mobile visitors will leave.
Updated April 2026 · By Gareth van Rensburg, Yoho Digital
If your website takes more than three seconds to load, more than half your mobile visitors will leave before they ever see what you offer[cite: 1]. That figure comes from Google’s own research, and a decade after they first published it, the picture has only got worse for slow sites[cite: 1]. Google now treats Core Web Vitals as a confirmed ranking signal, mobile-first indexing decides where you appear in search, and customer patience for sluggish pages keeps shrinking[cite: 1]. Even with an updated and optimised Wordpress Site, there are still improvements you can make.
This resource explores why website speed matters in 2026, how Google measures it, the technical fixes that move the needle, and the business case for treating performance as a core strategy.
TL;DR: “Failing Core Web Vitals? Our WordPress Upgrade Service typically reduces TTFB by 60% and fixes INP errors that plugins miss.”
| Metric | Name | Good Threshold | Primary Fix |
|---|---|---|---|
| LCP | Largest Contentful Paint | < 2.5s | Optimize Images & Hosting |
| INP | Interaction to Next Paint | < 200ms | Break up JS Tasks / Yield |
| CLS | Cumulative Layout Shift | < 0.1 | Set Image Dimensions |
1. What Website Speed Actually Costs You
Speed is a revenue lever, not just a technical concern. Google’s research found that 53% of mobile site visits are abandoned if pages take longer than three seconds to load. Sites loading in five seconds versus nineteen seconds saw 70% longer average sessions and 35% lower bounce rates.
A one-second delay in page load time is linked to a roughly 7% reduction in conversions. For an e-commerce site doing £100,000 a month, that is a £7,000 loss every month. In 2026, sites passing all Core Web Vitals thresholds see 24% lower bounce rates on average.
Slow sites also:
- Damage brand perception: A laggy site signals an outdated or careless business.
- Erode trust: Users experiencing friction are less likely to return.
- Compound losses: Bouncing visitors cannot share, link, or refer your content.
2. How Google Measures Speed: Core Web Vitals Explained
Since 2021, Google has measured page experience through three specific metrics that capture real-user experience.
The Three Metrics
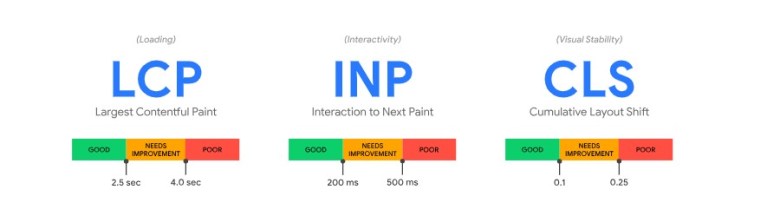
- Largest Contentful Paint (LCP): Measures loading speed; it should be under 2.5 seconds.
- Interaction to Next Paint (INP): Measures responsiveness; it should be under 200 milliseconds. This replaced FID in 2024 and is often the metric most sites fail.
- Cumulative Layout Shift (CLS): Measures visual stability; the score should be under 0.1.
Evaluation Standards
- 75th Percentile: Google looks at your slowest 25% of users to determine passing scores.
- Field Data: Google uses real user data (CrUX) rather than just lab tests.
- Pass/Fail: All three metrics must hit the “good” threshold to pass the overall assessment.
3. Diagnosing Your Site
Start by identifying what is broken using these tools:
- PageSpeed Insights: Provides both lab and field data.
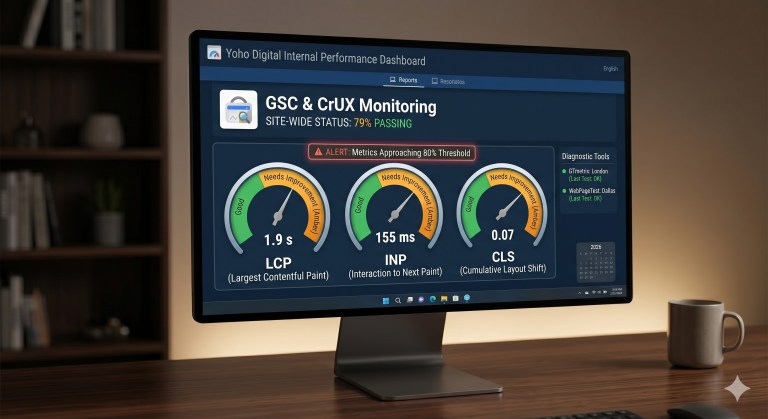
- Search Console CWV Report: Shows which specific URLs are failing across your site.
- GTmetrix & WebPageTest: Useful for simulating slower connections and specific locations.
Set internal alert thresholds at 80% of Google’s limits to catch regressions early (e.g., LCP at 2.0s)[cite: 1].
4. Technical Fixes with Code Examples
Fixing LCP
LCP usually fails due to slow server response or render-blocking resources[cite: 1]. Use modern formats like WebP or AVIF[cite: 1]:
<picture>
  <source srcset="hero.avif" type="image/avif">
  <source srcset="hero.webp" type="image/webp">
  <img src="hero.jpg" alt="Hero image" width="1200" height="630">
</picture>